In the last 365 days we've tracked:
💰 $12 Billion in Gross Merchant Volume
📊 $2.23 Billion in Ad Spend
🛍️ 140 Million Orders
🌍 In 50+ Countries
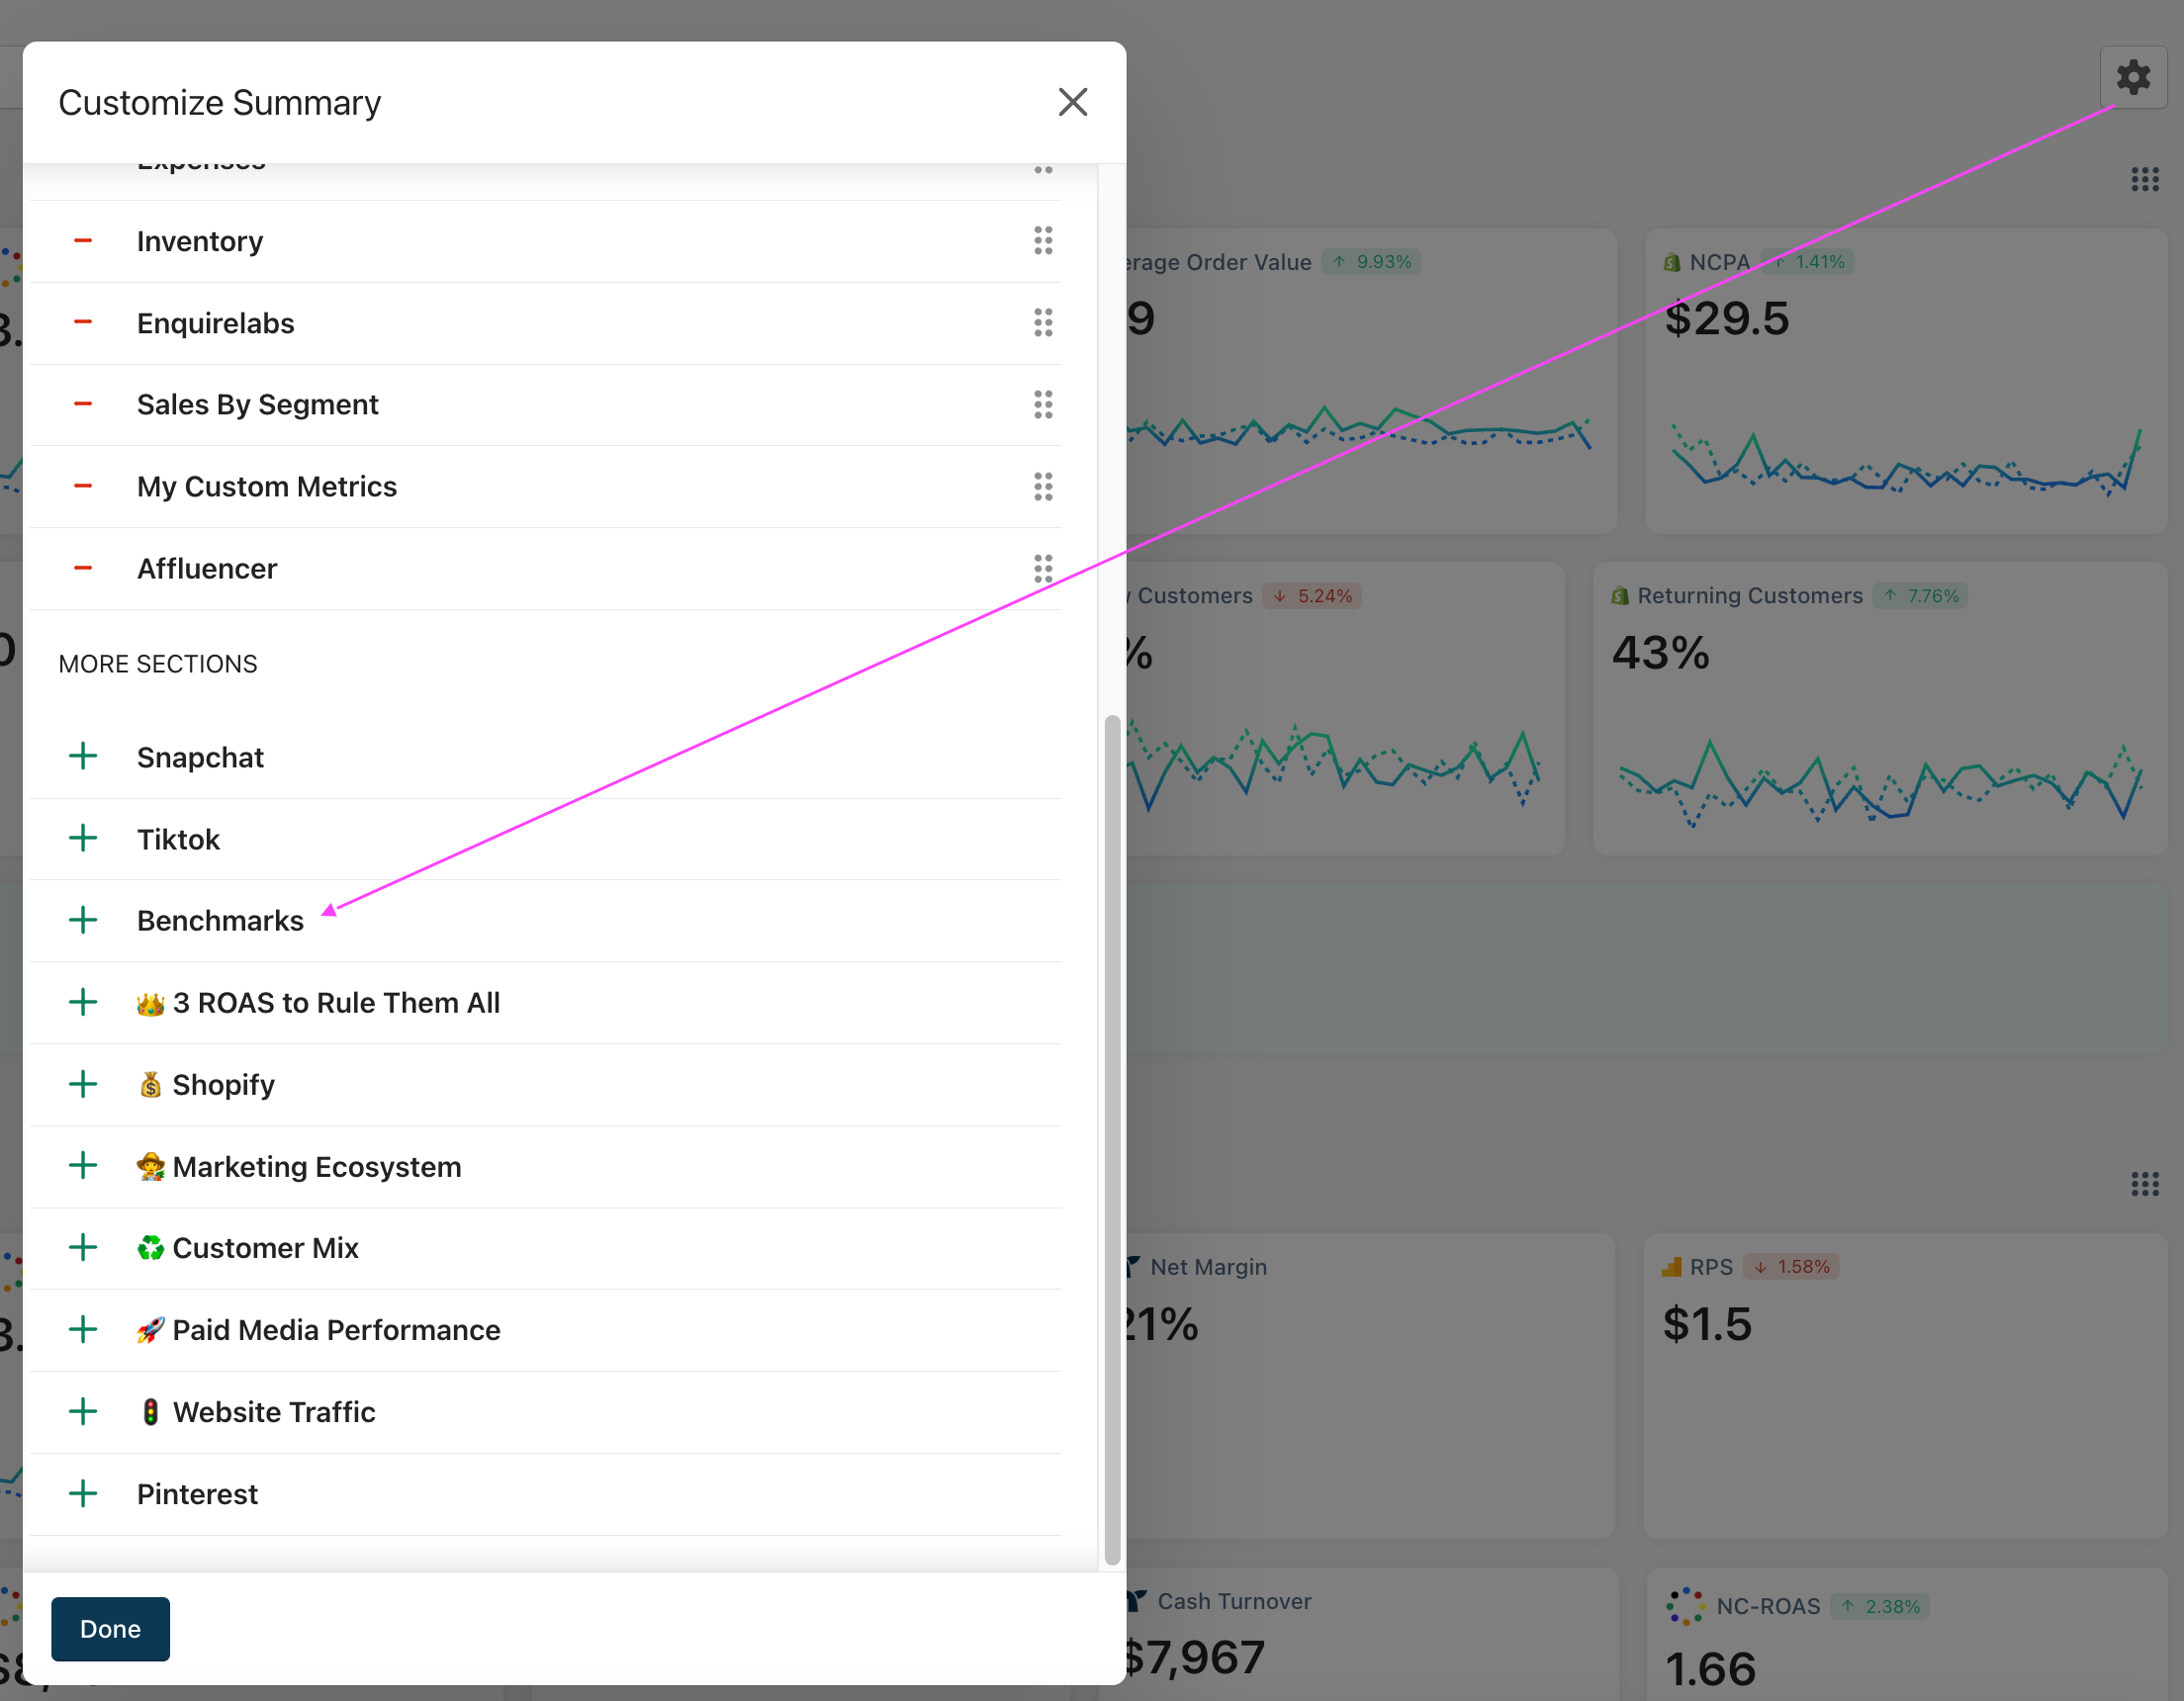
Access Triple Whale Benchmarks
Click on the cog in the upper right hand corner of your summary page
Choose “Customize Summary”
Scroll down until you see “Benchmarks”
Click the “+” icon, then move the section to your desired location on your summary page
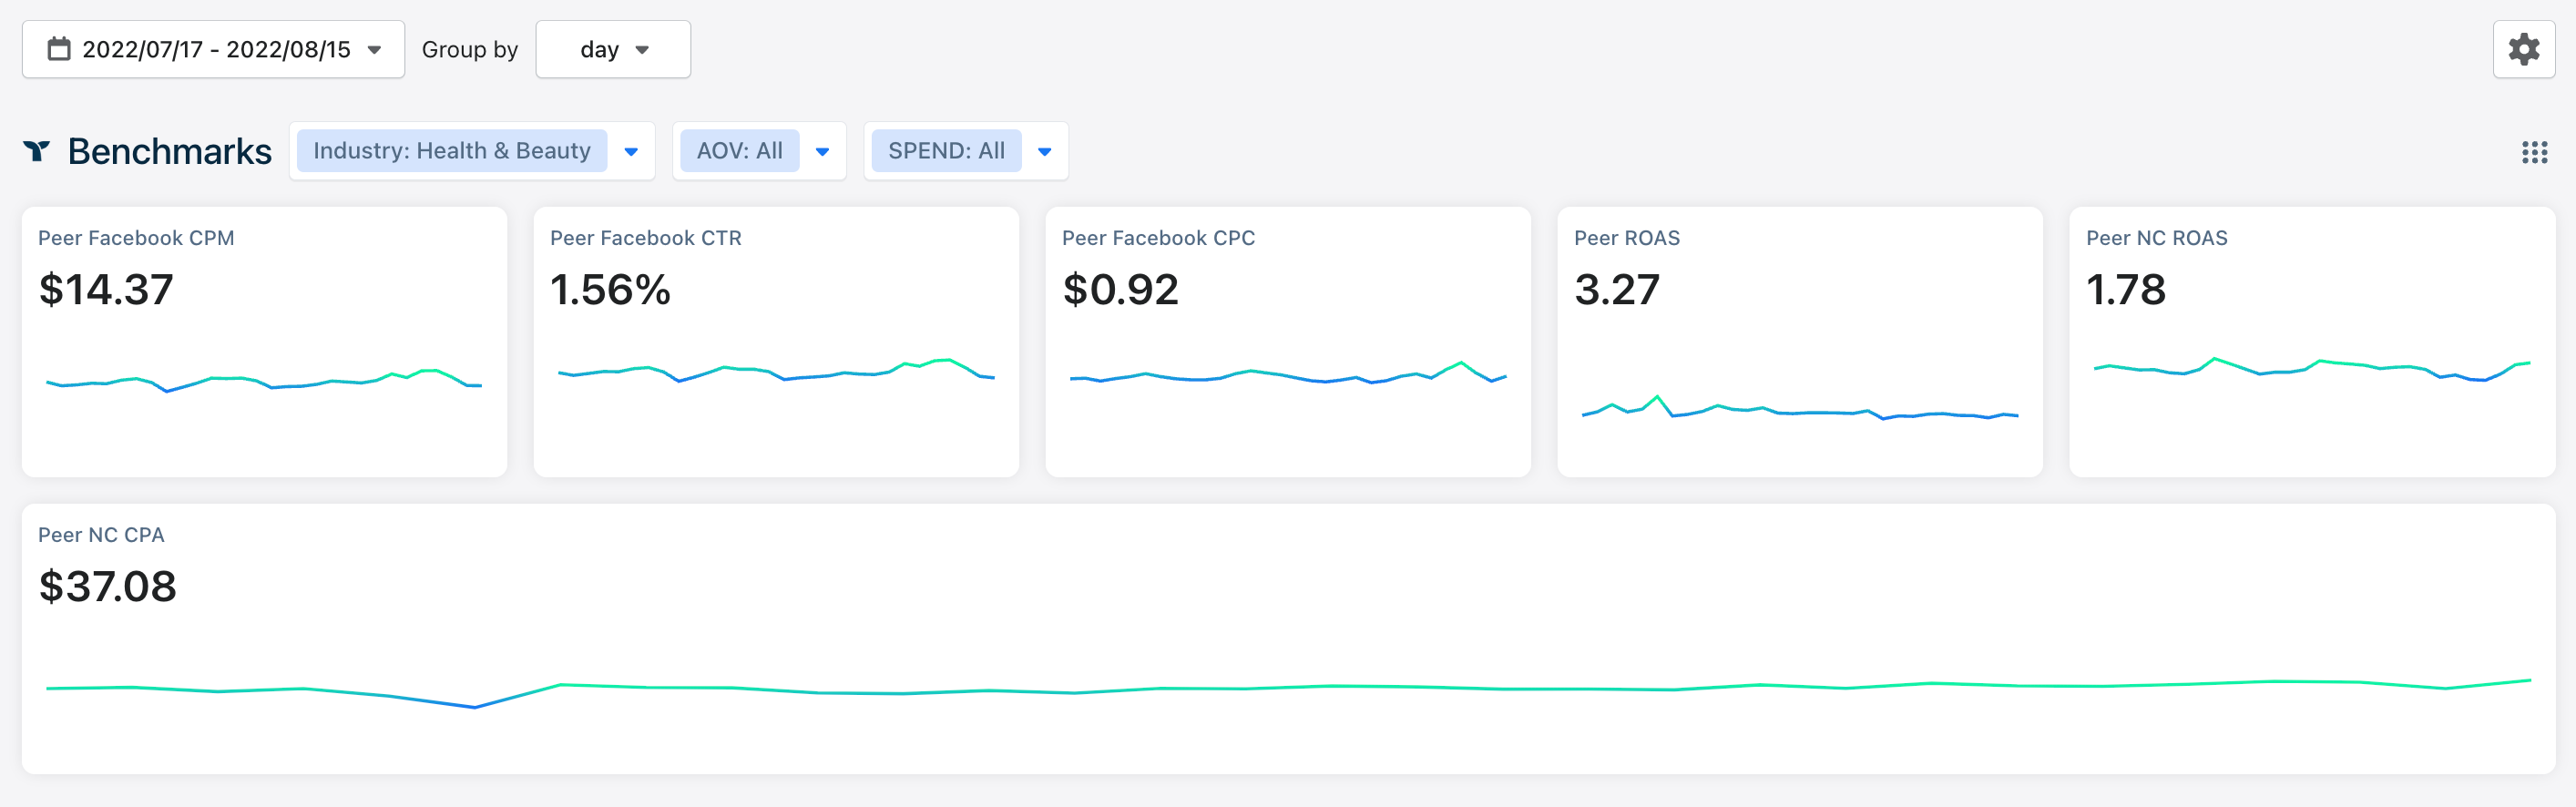
What filters are available for Triple Benchmarks?
Industry
- Art
- Baby
- Books
- Car & Truck Parts
- Cell Phones & Accessories
- Clothing
- Collectibles
- Computers
- Crafts
- Digital Products
- Electronics
- Fashion Accessories
- Food & Beverages
- Health & Beauty
- Home & Garden
- Jewelry & Watches
- Office Products
- Pet Supplies
- Shoes
- Sporting Goods
- Toys & Hobbies
Average Order Value (Average over the last 90 days (rolling))
- <$25
- $25-50
- $50-75
- $75-100
- $100-150
- $150
Blended Monthly Ad Spend (Average over the last 3 months (updated at the end of each month))
- <$10k
- $10-20k
- $20-50k
- $50-100k
- $100-250k
- $250k
What metrics are available in Triple Benchmarks?
- Facebook CPM $ (Cost per thousand impressions) = Total Amount Spent / Total Impressions x 1000
- Facebook CTR % (Click Thru Rate) = (Total link clicks / Total impressions) x 100
- Facebook CPC $(Cost per Link Click) = Facebook Ad Spend / Total link clicks
- Blended ROAS (# i.e. 5.5) = Sales / Blended Ad Spend
- NC-ROAS (new customer return on ad spend) (# i.e. 2.50) = New Customer revenue / Blended Ad Spend
- NCPA (New Customer Cost per Aqcuisition) ($ i.e. $30) = Blended Ad Spend / Count of New Customers